I recently gave a short intro of survival models to the team. Here, the goal is to lay out the basics and the motivate the use of survival analysis. Part II covers the Kaplan-Meier Estimator and Part III focuses on the Cox Proportional Hazards Model.
Motivation & Goals
- In many situations we would like to model the first time an event happens (time-to-event data). This could be the failure of a machine, the death of a cancer patient or the cancellation of a subscription. This leads us to estimate functions of survival and hazard (explained below).
- Once we actually managed to estimate survival and hazard functions we want to compare these for different sets of cancer patients, machines or subscribers. Each set could have received a different treatment (e.g. drug). This leads us to apply different statistical tests to compare, for example, the survival functions between groups.
- Lastly, we would like to know how certain explanatory variables are related to the survival time (of a patient). For this setting, the Cox Proportional Hazards Model has been developed.
The Premise - Censoring
The main challenge and the reason why survival models are different from, say empirical estimators, is that they have to deal with censoring. Generally, there are three types of censoring:
- Left Censoring
- we don’t know when true event occurred (e.g. infection at birth) - it was before the discovery
- Right Censoring
- we do not observe the event so that the true survival time is likely longer than what the study observes
- Interval Censoring
- the time of the event is not exactly observed, but bounded between two time points
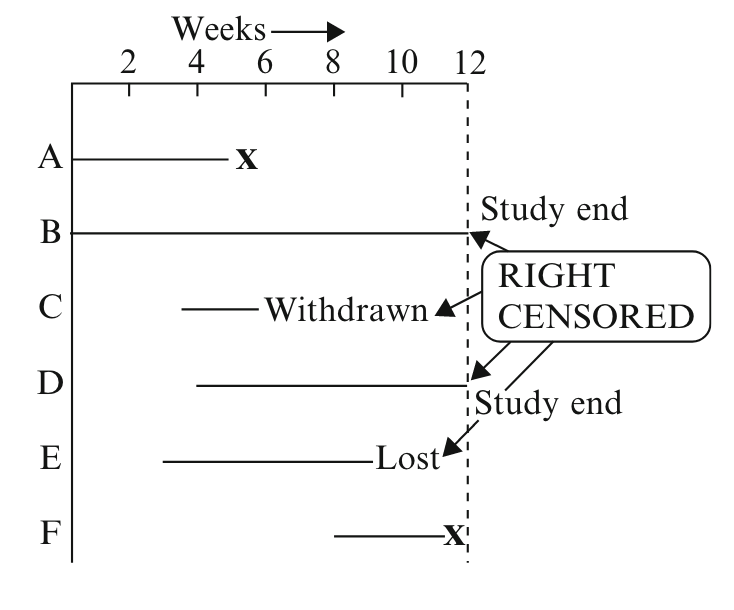
Right censoring is most commonly encountered and we will focus on right censoring for the remainder of this series. In medical studies, right censoring can occur when a patient moves away (loss to follow-up), the patient stops treatment (drop out) or the termination of the study. See picture below (Kleinbaum, Klein):
Key Metrics
Let’s define some key terms that will be useful for our models:
- Survival Time
- Let $T$ be a nonnegative ($T \leq 0$) random variable (RV) that represents the survival time of the object of study and let $t$ denote the specific value for $T$.
- Censorship
- Let $d = (0, 1)$ denote the RV whether the observation has been censored (=0) or not (=1).
- Survivor Function
- Let $S(t)$ be the survivor function that displays the probability of the object of study surviving longer than time $t$ ($P(T>t)$). Theoretically the curve would look like below (Kleinbaum, Klein):
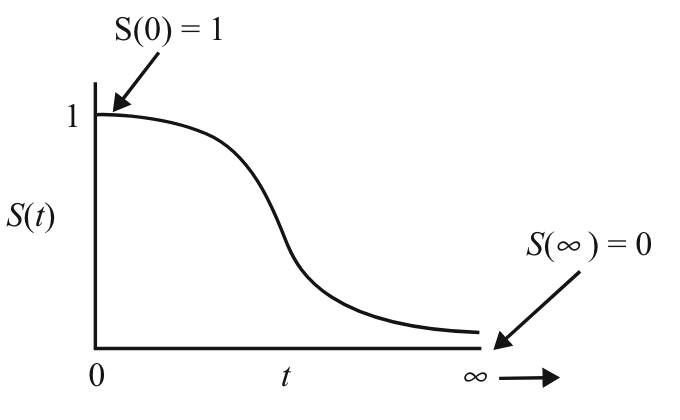
- By defining the cumulative distribution function (c.d.f) $F(t) = P(T \leq t) = \int_0^t f(x) \,dx$ of T where $f(t)$ equals the probability density function (p.d.f.), we can express the survivor function as $S(t) = P(T>t) = 1 - F(t) = \int_0^\infty f(x) \,dx$
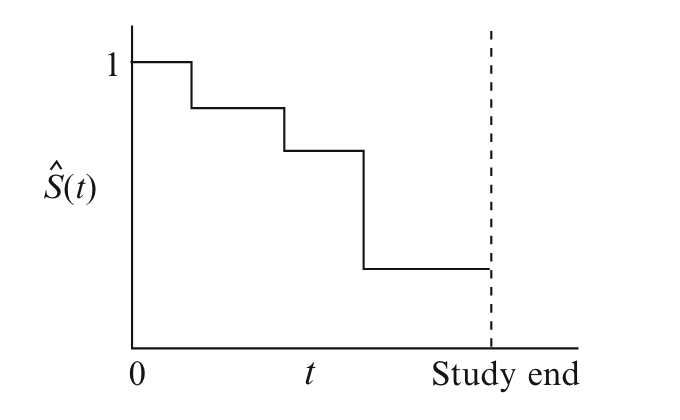
- In practice the survivor function takes the form of steps as can be seen below (Kleinbaum, Klein):
- Hazard Function
-
Let $h(t)$ be the hazard function that provides us with “the instantaneous potential per unit time [rate not probability] for the event to occur, given that the individual has survived up to time t” (Kleinbaum and Klein, 2012):
$\begin{aligned} h(t) = \lim_{\Delta t \rightarrow 0 } \frac{Pr( t \le T \le t + \Delta t \vert T > t)}{\Delta t} \end{aligned}$
- We can imagine the nominator $P(t \leq T \leq t + \Delta t \vert T > t)$ as the probability that the event happens to the object of study in the interval $\left[t, t + \Delta t \right]$ conditional on survival till time $t$.
- The hazard function cannot be negative $h(t) \geq 0$ and has not upper bound.
-
Now, the survivor function and the hazard function have a clearly defined relationship - they can be derived from each other. This is generally expressed with these formulaes:
$\begin{aligned} S(t) = \exp \left[ - \int_0^t h(u)du \right] \end{aligned}$
$\begin{aligned} h(t) = -\left[ \frac{dS(t)/dt}{s(t)}\right] \end{aligned}$
All of the above is neatly summarized in a diagram from the lifelines package:

Congrats if you made it this far! If you want delve into the application have a look at Part II of the series.
Sources
- Kleinbaum, D. G. & Klein, M. Survival analysis: a self-learning text. (Springer, 2012).
- Tableman, M. Survival Analysis Using S R*. (2016).
- Rodriguez, G. GR’s Website. https://data.princeton.edu/wws509/notes/c7s1.